
This guide will walk you through the included custom counter values, how to view the data in tools included in the operating system, and reference to third party service providers that can integrate with this data.
The number of active threads Hurricane MTA is consuming for message processing
The number of messages in the processing of being signed with DKIM signatures. DKIM signing can be a CPU intensive process for large messages (>3mb). A large number of simultaneous dk operations could cause (or be caused by) high CPU consumption
The average number of new inbound SMTP connections being accepted each second
The number of active concurrent SMTP connections incoming to the Hurricane MTA installation
The total number of messages that have been processed (Sent or Failed) since the MTA services have been restarted
The average number of messages being processed per second
The total number of messages in queue and awaiting delivery
The average number of new outgoing SMTP connections being created each second
The number of active concurrent outgoing SMTP connections to recipient mail servers
The number of active regex operations being performed by the MTA. A regex
The number of active threads Hurricane MTAis creating each second
The number of concurrent open and click tracking operations being performed. Open and Click tracking requires parsing the entire HTML content of a message so this process can be CPU intensive for messages with large amounts of HTML content (>512kb). A large number of simultaneous tracking operations could cause (or be caused by) high CPU consumption
To view these performance counters follow these steps:
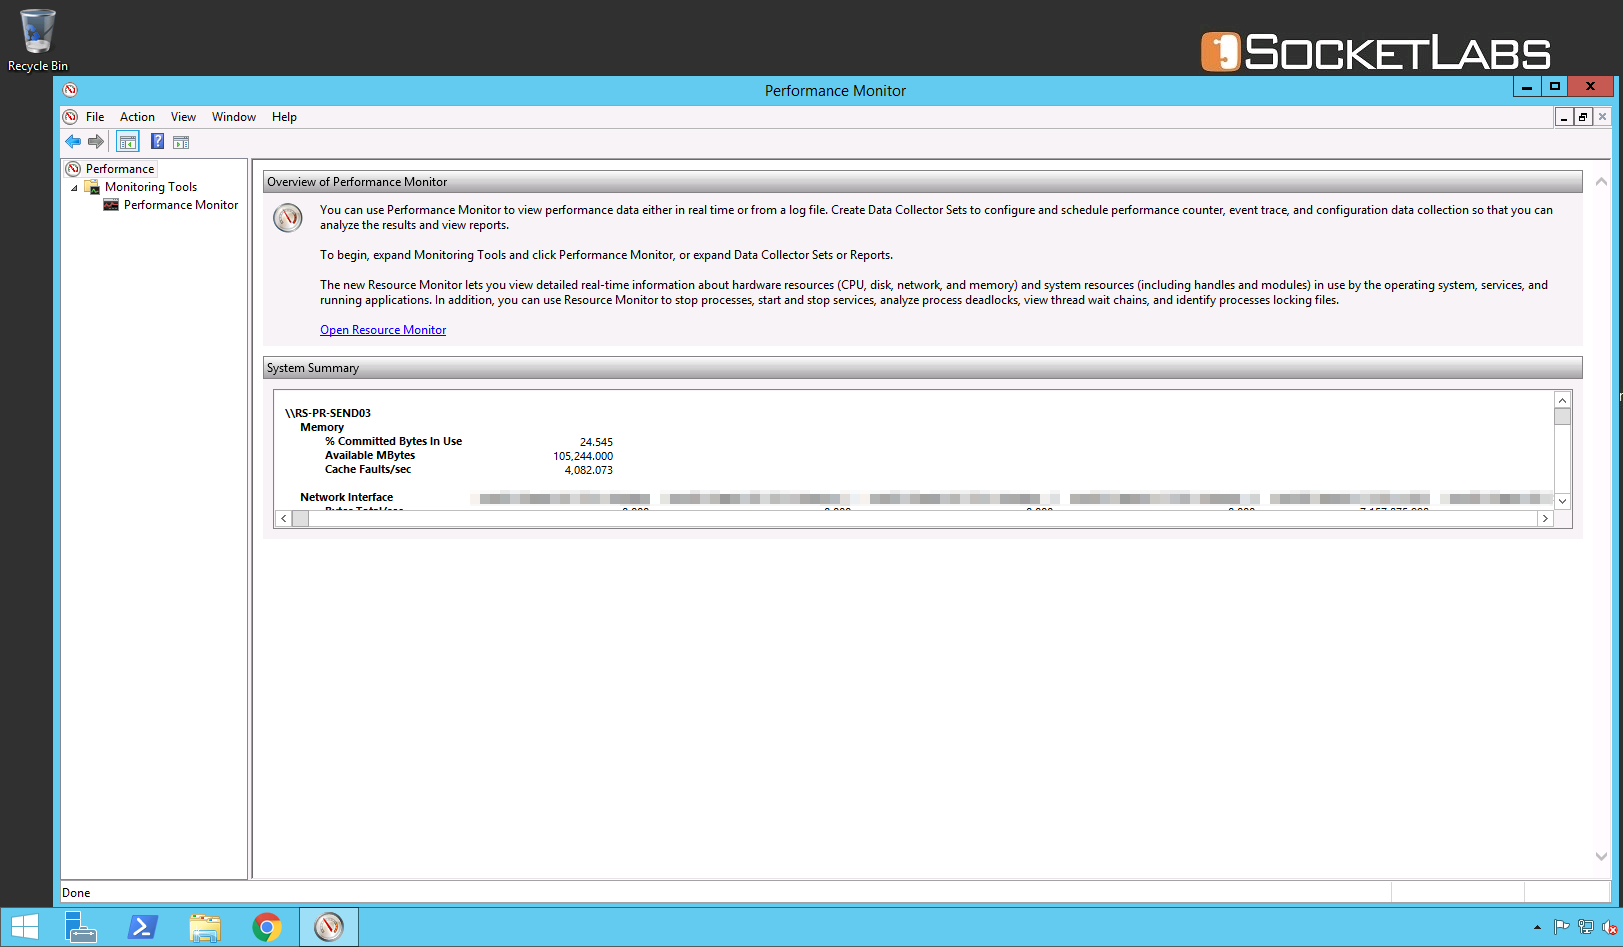
- Open the Performance Monitor application
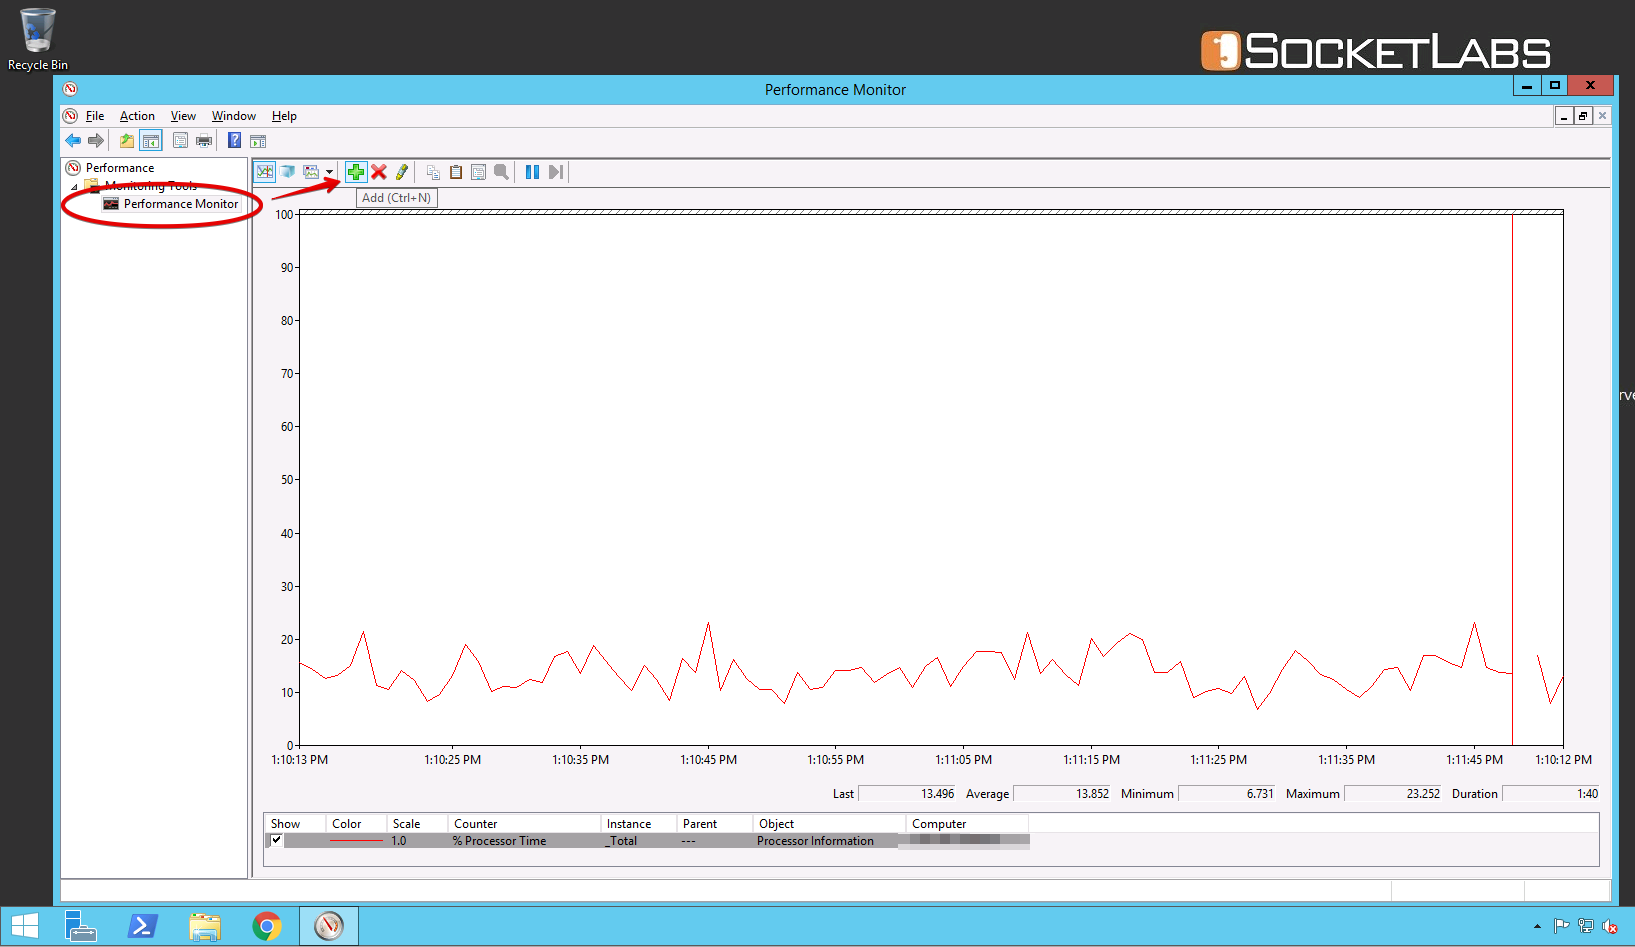
- To add the custom performance counters, first Select Performance Monitor from the left-hand menu under the Monitoring Tools folder, then click the Add ( + ) button:
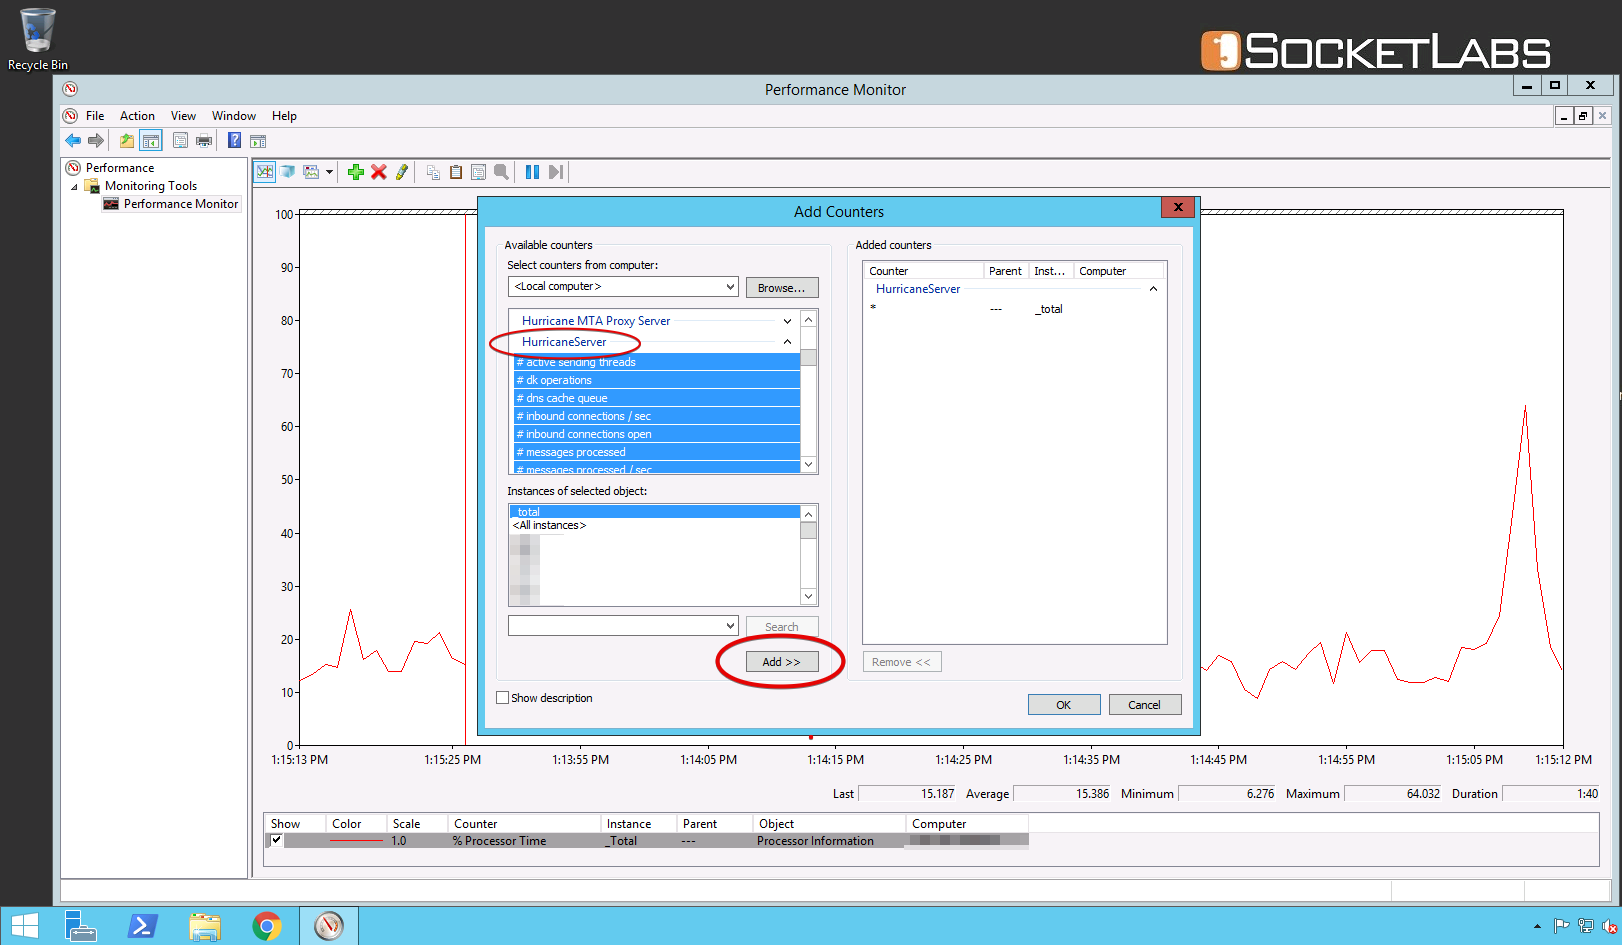
- From the add counters dialog, find the HurricaneServer sub-section from the list of counters available on the machine. Highlight the desired counters you'd like to monitor. Under the "Instances of selected object" dialog, you can select or more of three options:
- _total - An aggregate of all the data from all Hurricane MTA accounts added together. This is the most popular options and allows for high level overview of application performance.
- < All Instances > - Select to display the chosen counters for all accounts, each appearing individually on the graph or report
- AccountID(s) - A list of specific MTA account ID numbers will be listed below these two options, select one or more to display the counters just for these accounts.
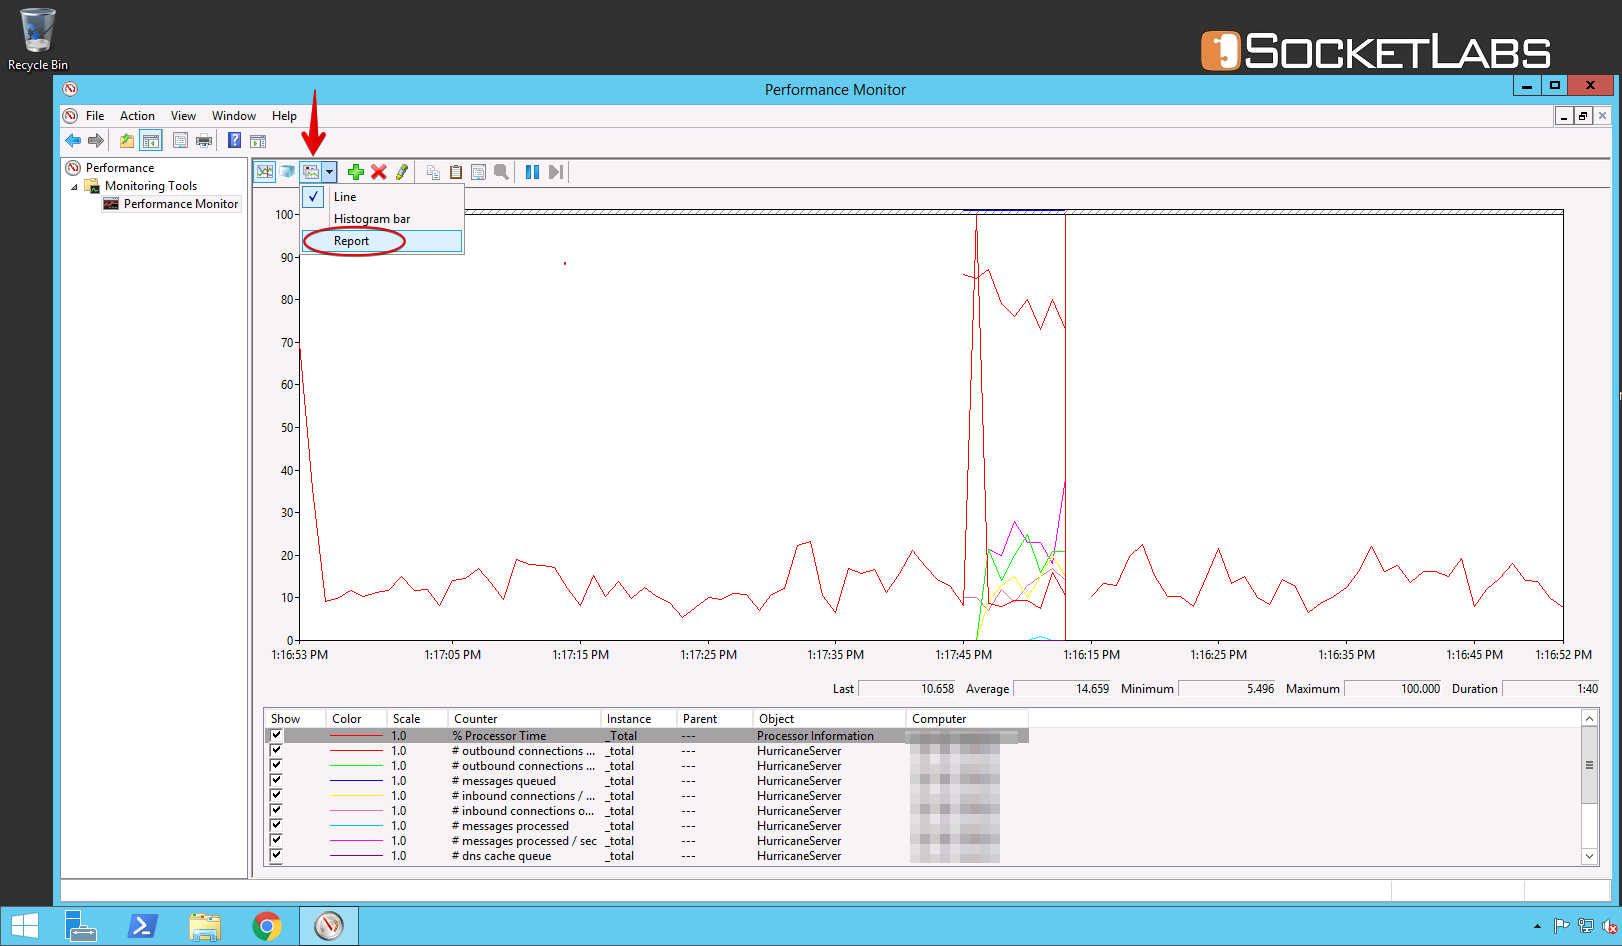
- Once the counters and instances have been selected and added, you will be initially displayed a graph of all these data points. While charts normally help visually performance data well, we've found that the "Report" view is a more optimal means of checking into this data and information. The "Report" view can be found under the chart type menu option highlighted below:
- You should now be presented with all of the selected performance counters in report mode:
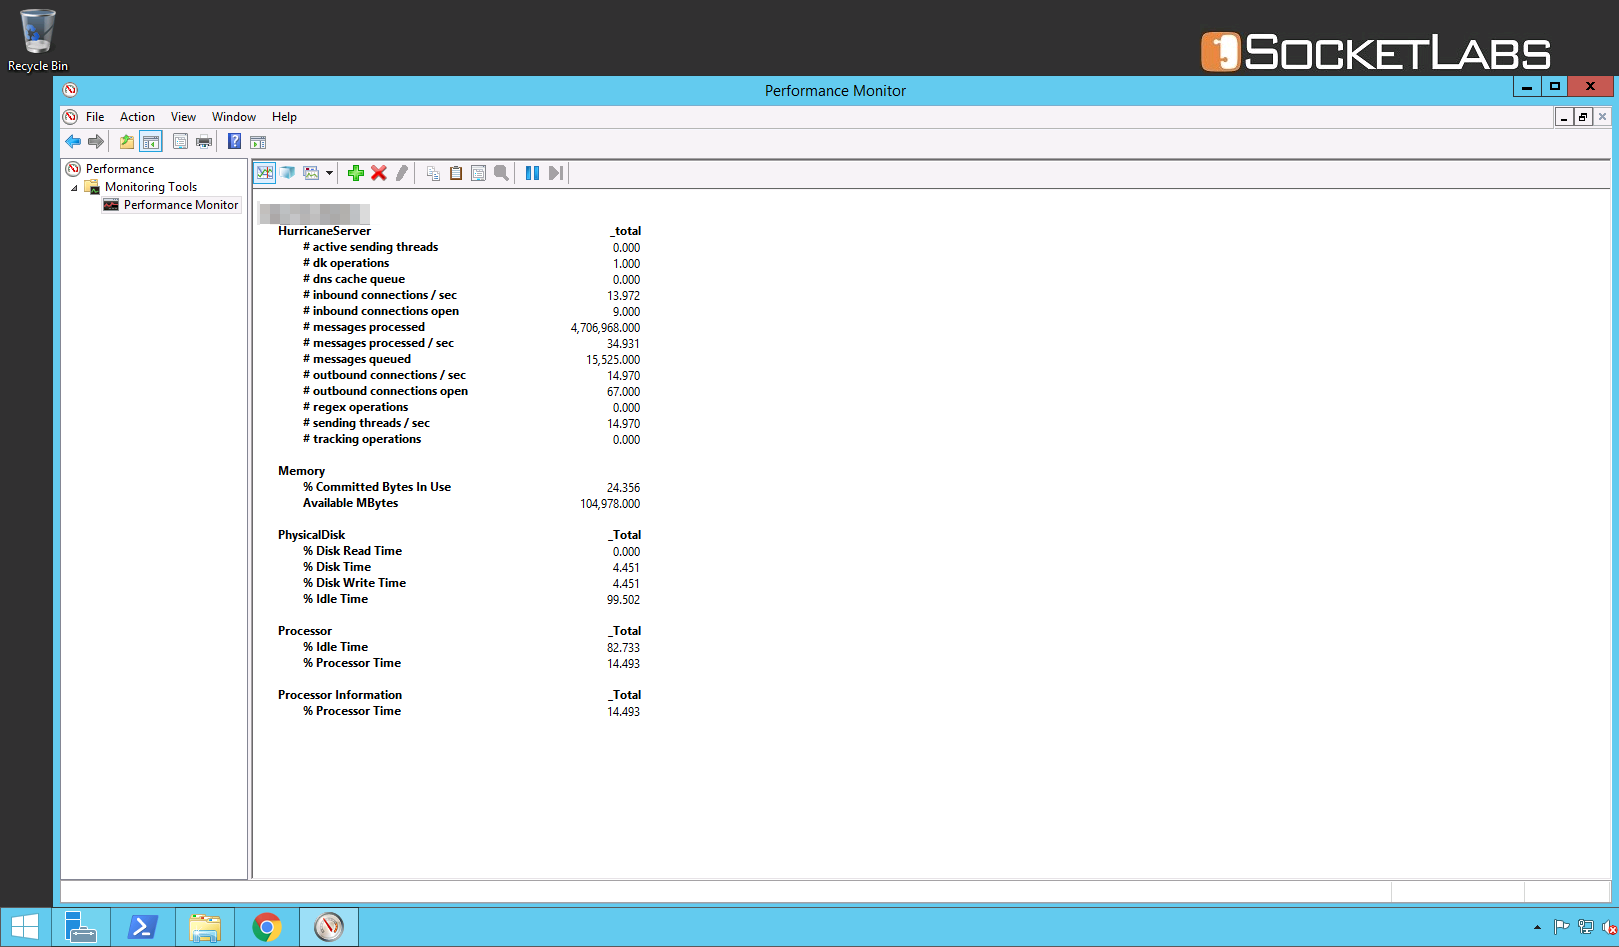
This data is very valuable when in the midst of troubleshooting and analyzing performance of an MTA installation.